Grafana: Data Visualization and Monitoring (GRAF1)
Virtualization, Kubernetes
Are you looking to effectively visualize and monitor your data in real-time? Grafana is a powerful open-source platform for monitoring and observability, enabling you to create dynamic, interactive dashboards from a variety of data sources. This course provides a practical introduction to Grafana, including installation, data source integration, dashboard creation, and alerting. You’ll gain hands-on experience with key features and best practices for using Grafana in a professional environment.
By the end of this course, participants will be able to install Grafana, configure it with different data sources, create interactive dashboards, and set up alerts to monitor key metrics.
THIS TRAINING COURSE WILL HELP YOU:
- Understand the importance of data visualization in monitoring and observability
- Install and configure Grafana on Linux or Kubernetes
- Connect Grafana with popular data sources like Prometheus, Loki, and PCP
- Build and customize dashboards with variables and panels
- Set up alerting to monitor important metrics and thresholds
- (For Kubernetes) Work with the Grafana Operator and Custom Resource Definitions (CRD) for advanced configuration
WHO SHOULD ATTEND?
- IT professionals and system administrators looking to implement real-time monitoring and visualization of metrics.
- Developers and DevOps engineers who want to integrate Grafana into their existing infrastructure.
- Anyone working with Prometheus, Loki, or other data sources and looking to visualize and monitor metrics effectively.
COURSE LOCATION AND AVAILABLE DATES
Need this course in English?
Public courses are usually delivered in Czech, but this course is also available in English. We can arrange private training for your team online, at your premises or in our classrooms, and tailor the content to your needs.
For groups of around 4 or more participants, private training can already be comparable in price to booking individual places on a public course. Send us your requirements and we’ll recommend the best format and provide an exact quote.
Request training in English
Course content:
Hide details
-
Why Data Visualization and Grafana?
-
Importance of visualizing data for real-time monitoring.
-
Introduction to Grafana and its core features.
-
Use cases of Grafana in various environments.
-
Installing Grafana
-
Installation on Linux.
-
Configuring Grafana for Kubernetes environments (optional).
-
Initial configuration and security settings.
-
Data Sources
-
Overview of supported data sources.
-
Connecting Grafana with Prometheus, Loki, and PCP.
-
(Optional: focus on Prometheus if preferred for specific training needs).
-
Building and Customizing Dashboards
-
Creating and importing dashboards.
-
Using variables for dynamic dashboards.
-
Working with panels: visualizations, graphs, and other data displays.
-
Best practices for building effective dashboards.
-
Alerting in Grafana
-
Setting up alerting rules.
-
Integrating notifications: email, Slack, and other platforms.
-
Managing and monitoring alerting within dashboards.
-
(Optional for Kubernetes) Grafana Operator and CRDs
-
Overview of the Grafana Operator for Kubernetes.
-
Using Custom Resource Definitions (CRD) for advanced configuration.
-
Managing Grafana instances in a Kubernetes environment.
-
Schedule:
-
1 day (9:00-17:00)
Training and learning environment
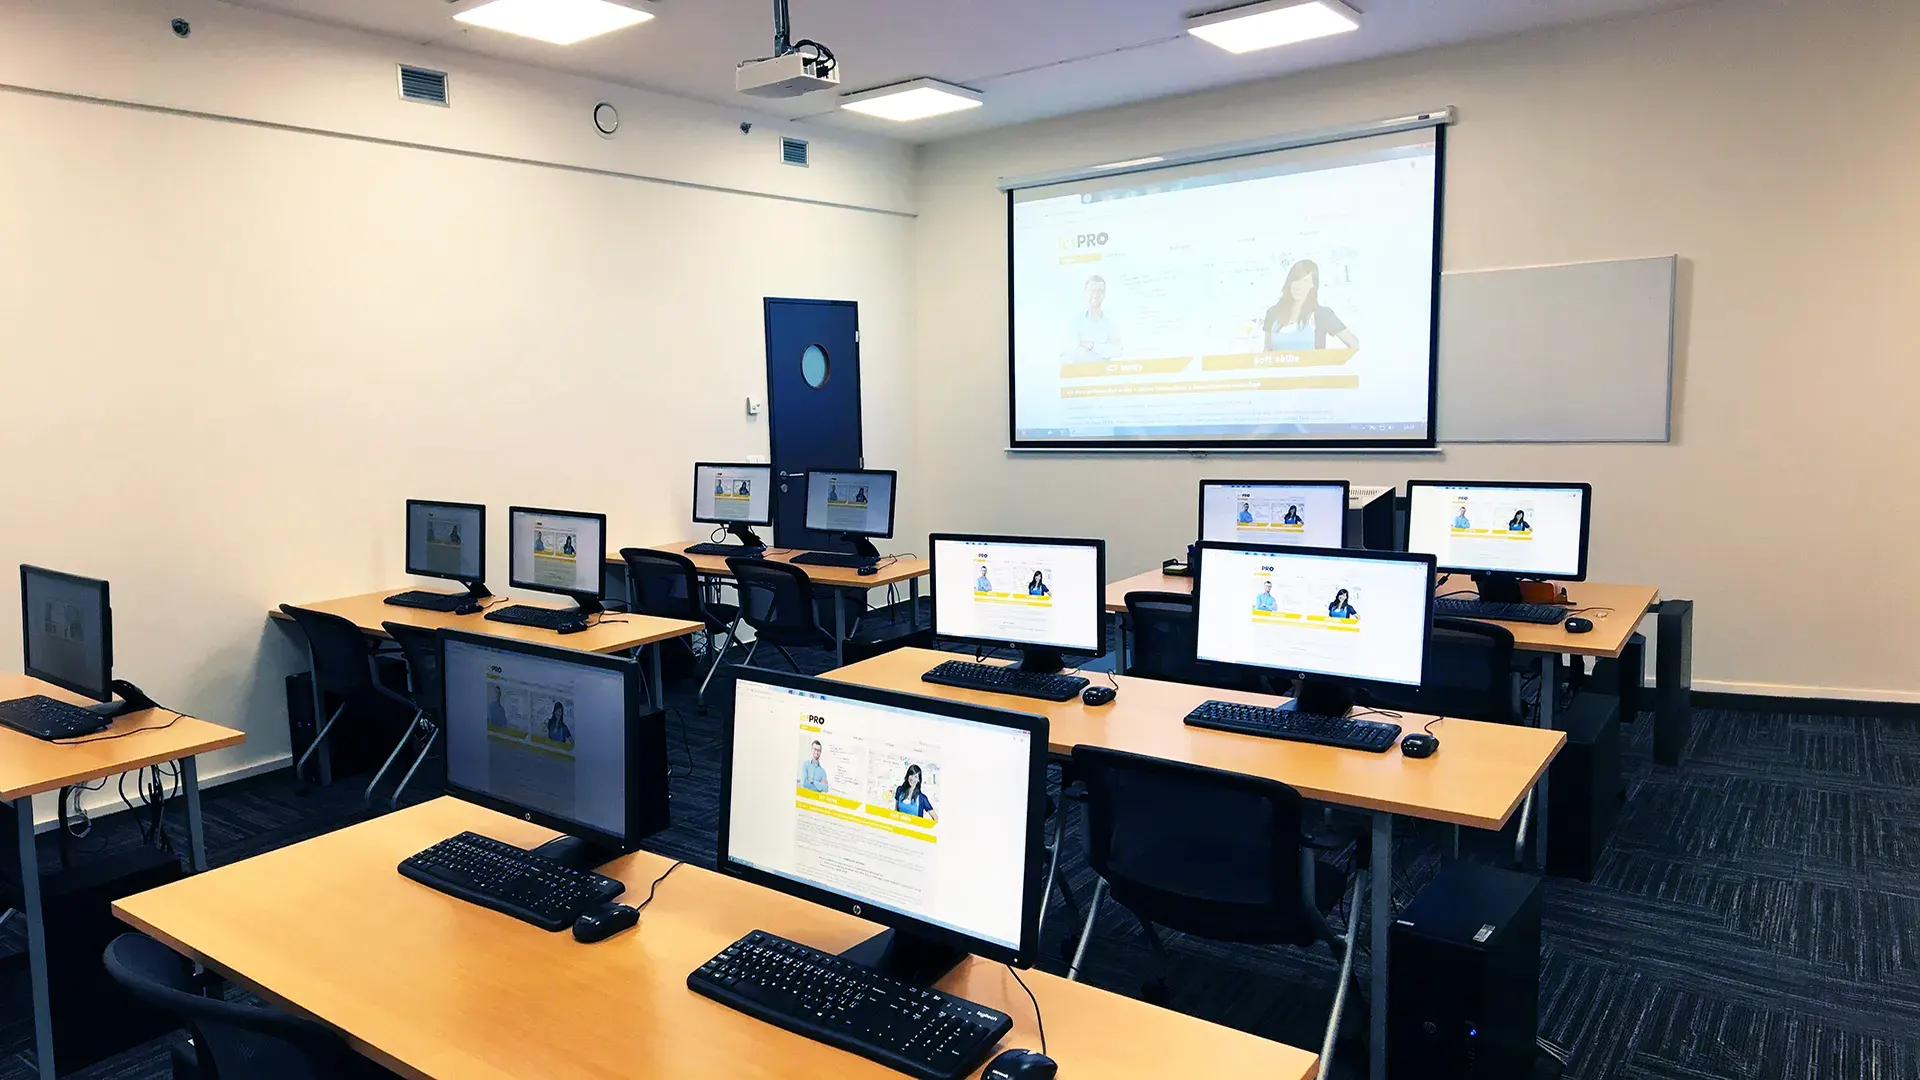 What does the environment for in-person IT courses look like?We hold training courses in our own classrooms equipped with modern computer equipment for each participant and a large projection screen. Each workstation is fitted with a powerful computer for seamless practical exercises, and the environment supports a calm, friendly atmosphere during training.
 Do I need to bring my own laptop to the classroom IT course?Our training rooms are fully equipped, so you do not need to bring your own laptop. A modern computer with all necessary hardware and software is ready for you at your workstation.
 Will you receive an official certificate after completing an IT course?Yes, upon successful completion of the training course, you will receive an official ICT Pro certificate confirming your participation and acquired technical skills. You can use it to verify your qualifications or add it to your professional profile.
 Where can you find our training center in Brno?The premises of the ICT Pro training center are located on the 1st floor of the COMGUARD building at Sochorova 38 in Brno. Positioned on the border of Žabovřesky and Komín, the location is easily accessible by both car and public transport.
 Where can you find our training center in Prague?The premises of the ICT Pro training center are located on the 1st floor of the Opatov Park building at Líbalova 1, Prague 11 – Chodov. The location provides a comfortable environment for your education with convenient access.
 What facilities and refreshments are available to you during training breaks?Our training centers feature a fully equipped kitchenette for a comfortable break during your courses. The facilities include a coffee machine, microwave, kettle, and a wide selection of drinks and snacks.
 What beverage refreshments are available during your course?A beverage station with a coffee machine, teas, syrups, and water is at your disposal throughout the entire training session. You can enjoy a coffee or another drink of your choice anytime during breaks.
 What light refreshments are provided for you during the courses?During course breaks, participants can enjoy light sweet snacks, pastries, and fruit syrups to mix their own drinks. Fresh water dispenser and plates are also available for your convenience.
 Should I bring my own snacks to ICT Pro training?There is no need to. A wide selection of savory snacks, sweet biscuits, and snack bars is available for you during breaks. Boost your energy for all-day focus right inside the training center premises.
 Can you spend training breaks in the fresh air?Yes, an outdoor terrace is available at our training center. During breaks between learning sessions, you can relax in the fresh air in a pleasant green environment.
 Where can you relax during course breaks?Our training center features a spacious outdoor terrace with seating options. During breaks between learning sessions, you can step outside to relax and recharge in the fresh air.