MS Fabric – Introduction to data processing, analysis and visualization (FABA1)
Microsoft, Fabric
This course introduces Microsoft Fabric through practical exercises and demos, giving you hands-on experience with core services. You will learn to ingest, clean and integrate data using Dataflows, store and manage datasets in Datamarts, and build a reusable Semantic model for analysis.
During hands-on labs you'll build one-off and scheduled reports, create interactive dashboards and use AI report generation, learn basics of DAX for calculations, export results to Excel and share or publish reports across the Fabric workspace with governance and refresh options.
THIS TRAINING COURSE WILL HELP YOU:
- Connect and integrate multiple data sources for analysis
- Create ad-hoc and scheduled reports with minimal technical effort
- Design engaging visualizations and dashboards for better insight
WHO SHOULD ATTEND?
- Data analysts seeking practical skills with advanced Fabric tools
- Developers who connect data sources and build stronger visual reports
- Data enthusiasts looking to learn modern Fabric-based data workflows
COURSE LOCATION AND AVAILABLE DATES
14–16 Sep 2026
576 €
CZECH
Praha + online (optional)
14–16 Oct 2026
576 €
CZECH
Private training
Unlock your employees' potential. We can adapt every course in our portfolio to your objectives and participants.
Need training at your premises or want to tailor the content and duration? We will prepare the right solution, in Czech or English.
Request customised training
Course content:
Hide details
-
Introduction to MS Fabric components for data analysis
-
Dataflow / Dataflows
-
Semantic model
-
Report
-
Dashboard
-
Datamart
-
OneLake
-
Creating a process for regular data refresh
-
Possible data sources
-
Possible data destinations
-
Handling missing, erroneous or duplicate values
-
Adding new columns
-
Merging data from multiple sources
-
Basic overview of the applied procedure
-
Building a semantic model for analysis
-
Creating relationships
-
Generating an automatic report using AI
-
Exporting data to Excel
-
Creating reports and dashboards for visualization
-
Difference between a report and a dashboard
-
Overview of visual types and import options
-
Adjusting visual interactions
-
Page types and their use for advanced visuals
-
Export options (PowerPoint, PDF, etc.)
-
Sharing and publishing options
-
Creating a datamart to store transformed data
-
Possible data sources
-
Data transformation and shaping
-
Using the datamart for reports, custom SQL or DAX analysis
-
Visual queries via SQL generated by the datamart
-
Introduction to DAX
-
DAX syntax
-
Calculated columns, measures and calculated tables — principles and differences
-
Handling errors in calculations
-
Calculation context (filter, row and query contexts)
-
Basic DAX functions for numbers, text and dates
-
Filter functions
-
Iterators (MINX, SUMX, RANKX, ISINSCOPE, etc.)
-
Conditional calculations
-
Prerequisites:
-
Comfortable with MS Excel and pivot tables; basic database familiarity is helpful.
-
Recommended previous course:
-
MS Excel – Data transformation in Power Query, step by step (PWQ1)
-
Schedule:
-
3 days (9:00-17:00)
-
Price per person:
-
576.00 € ( 696.96 € incl. 21% VAT)
Training and learning environment
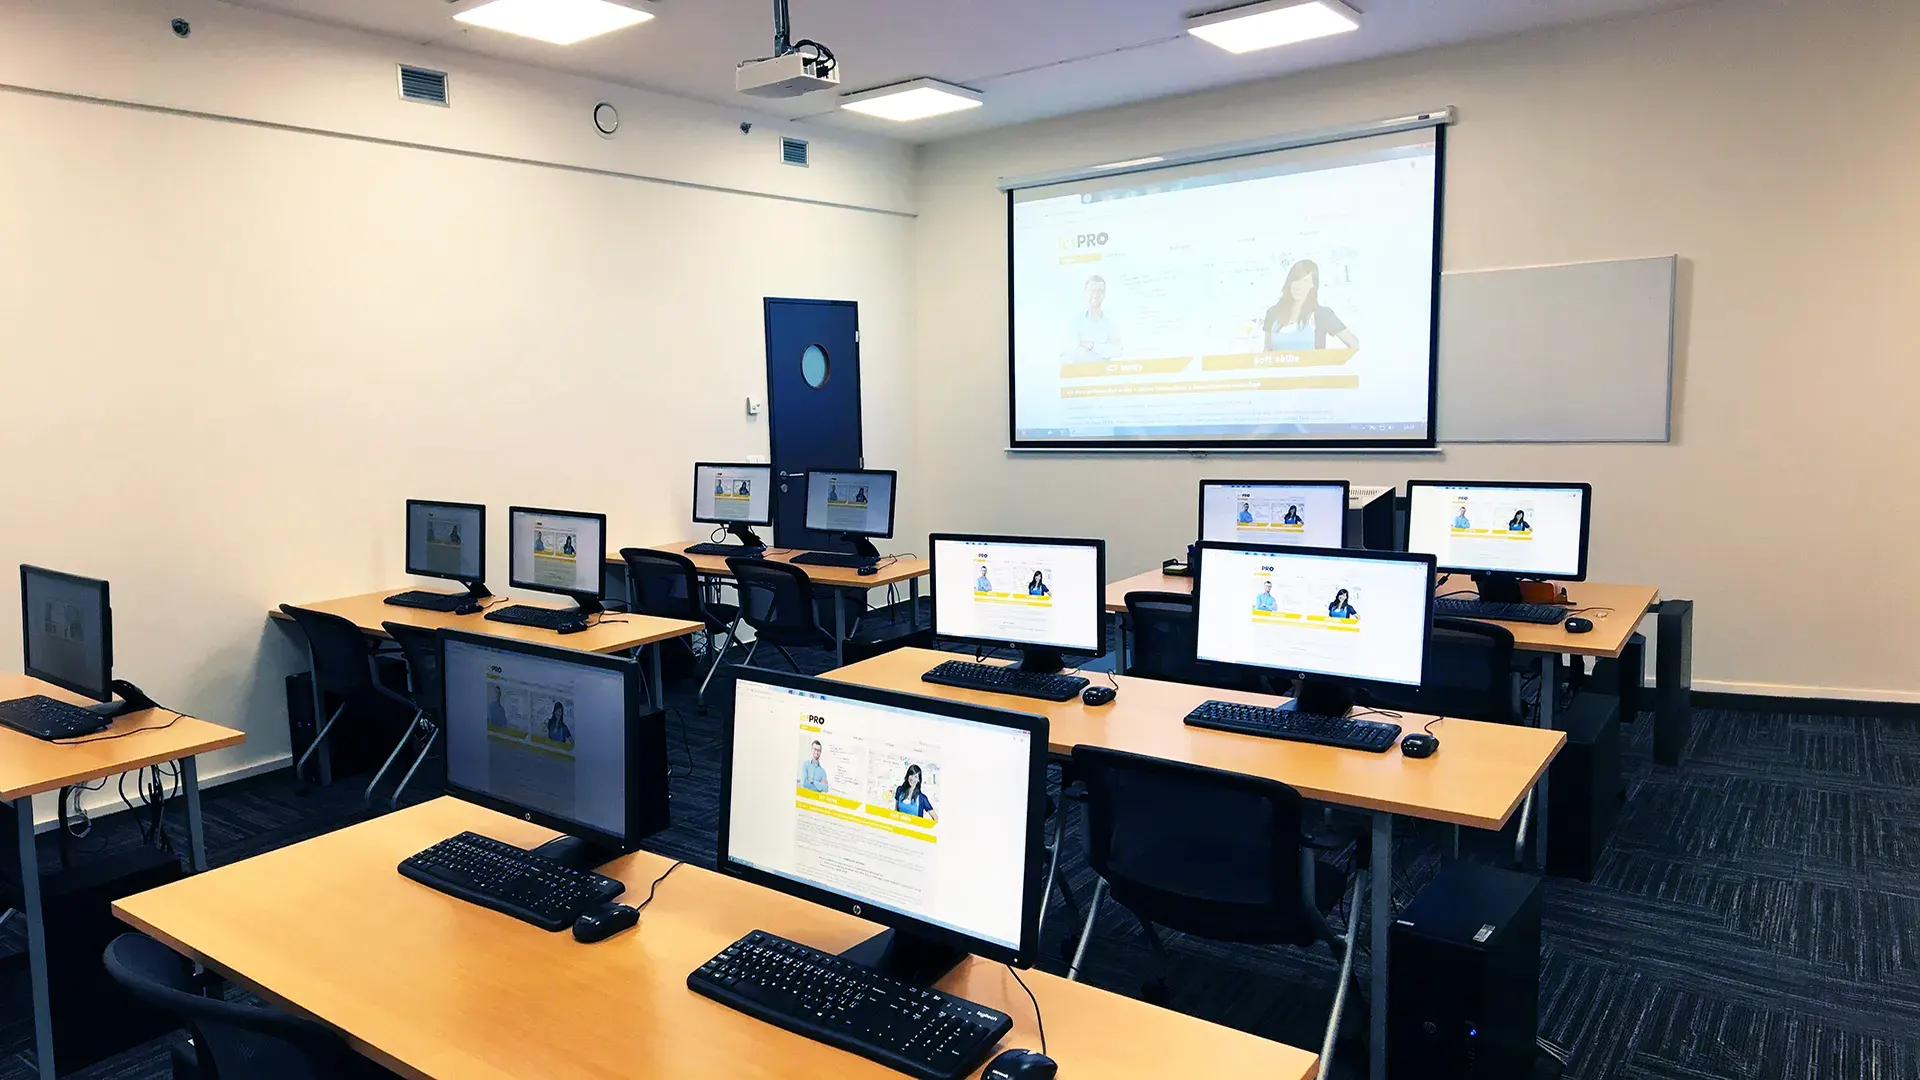 What does the environment for in-person IT courses look like?We hold training courses in our own classrooms equipped with modern computer equipment for each participant and a large projection screen. Each workstation is fitted with a powerful computer for seamless practical exercises, and the environment supports a calm, friendly atmosphere during training.
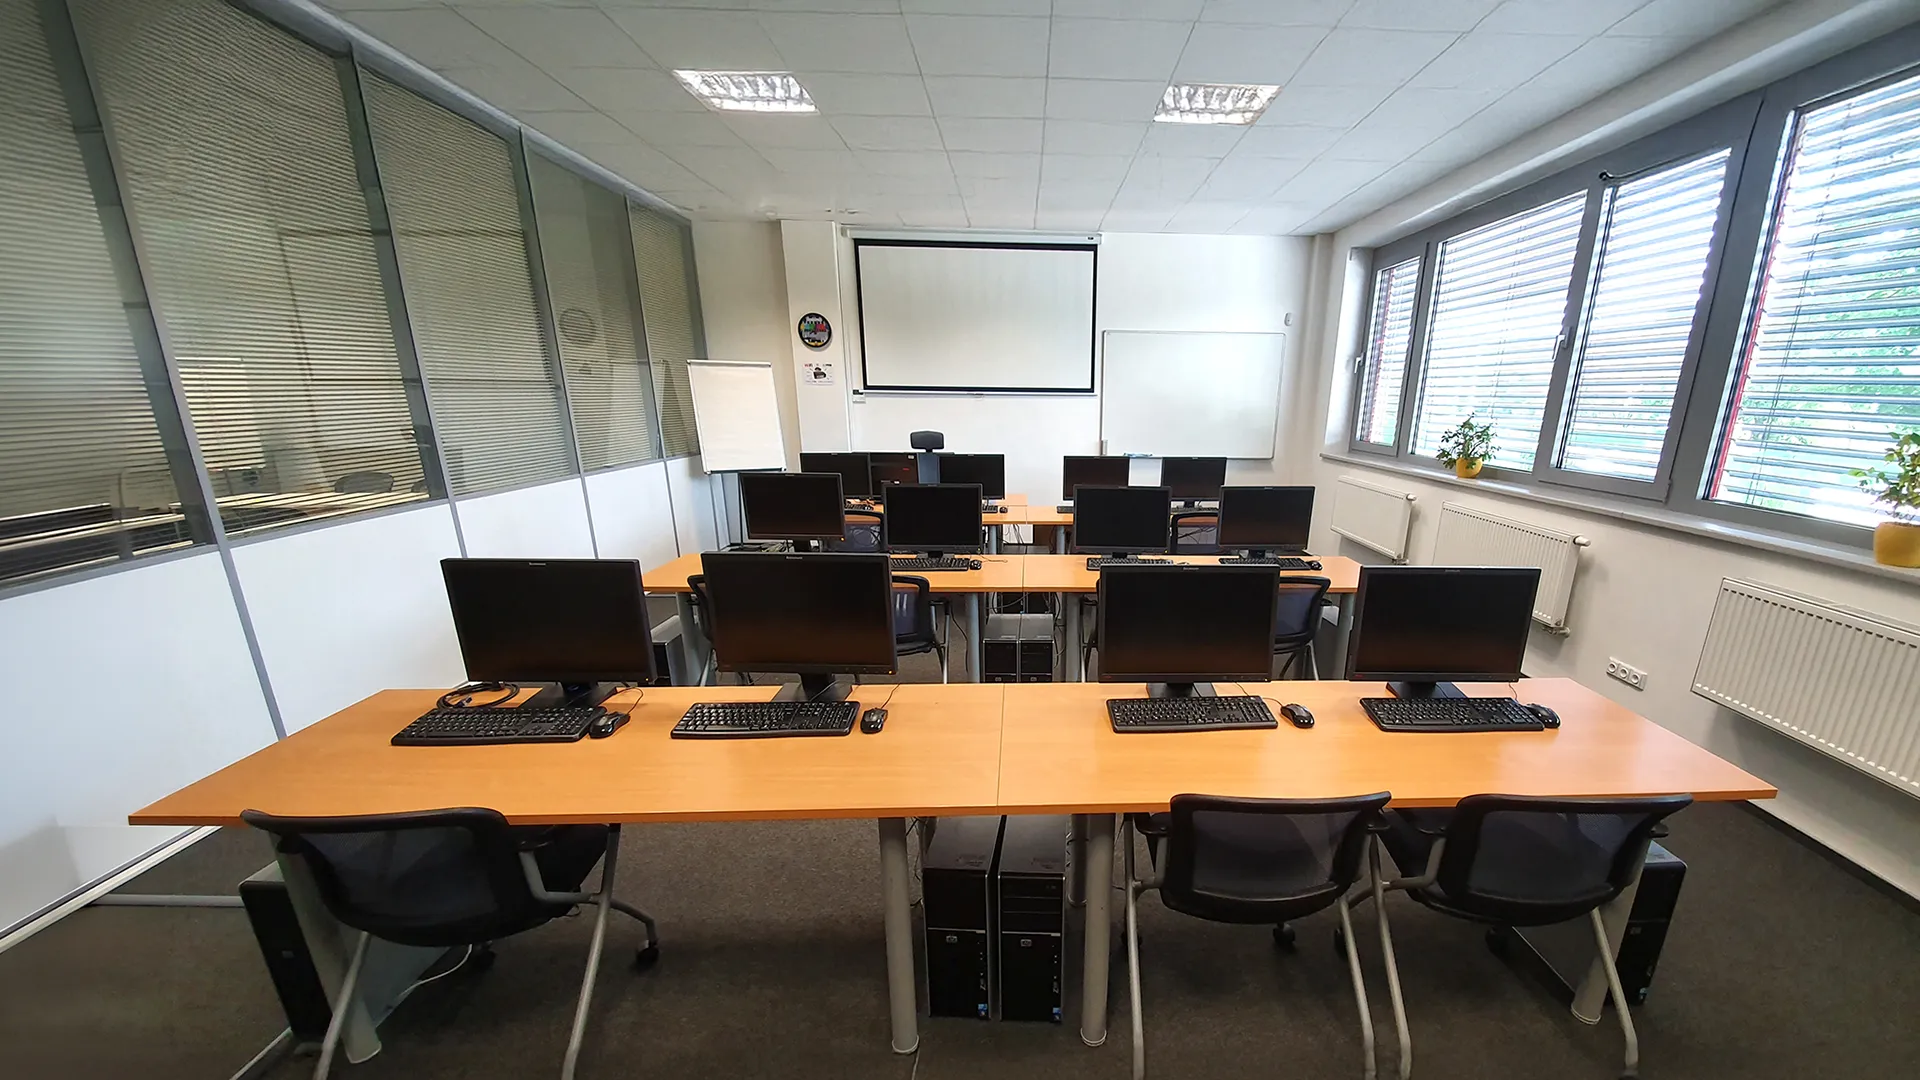 Do I need to bring my own laptop to the classroom IT course?Our training rooms are fully equipped, so you do not need to bring your own laptop. A modern computer with all necessary hardware and software is ready for you at your workstation.
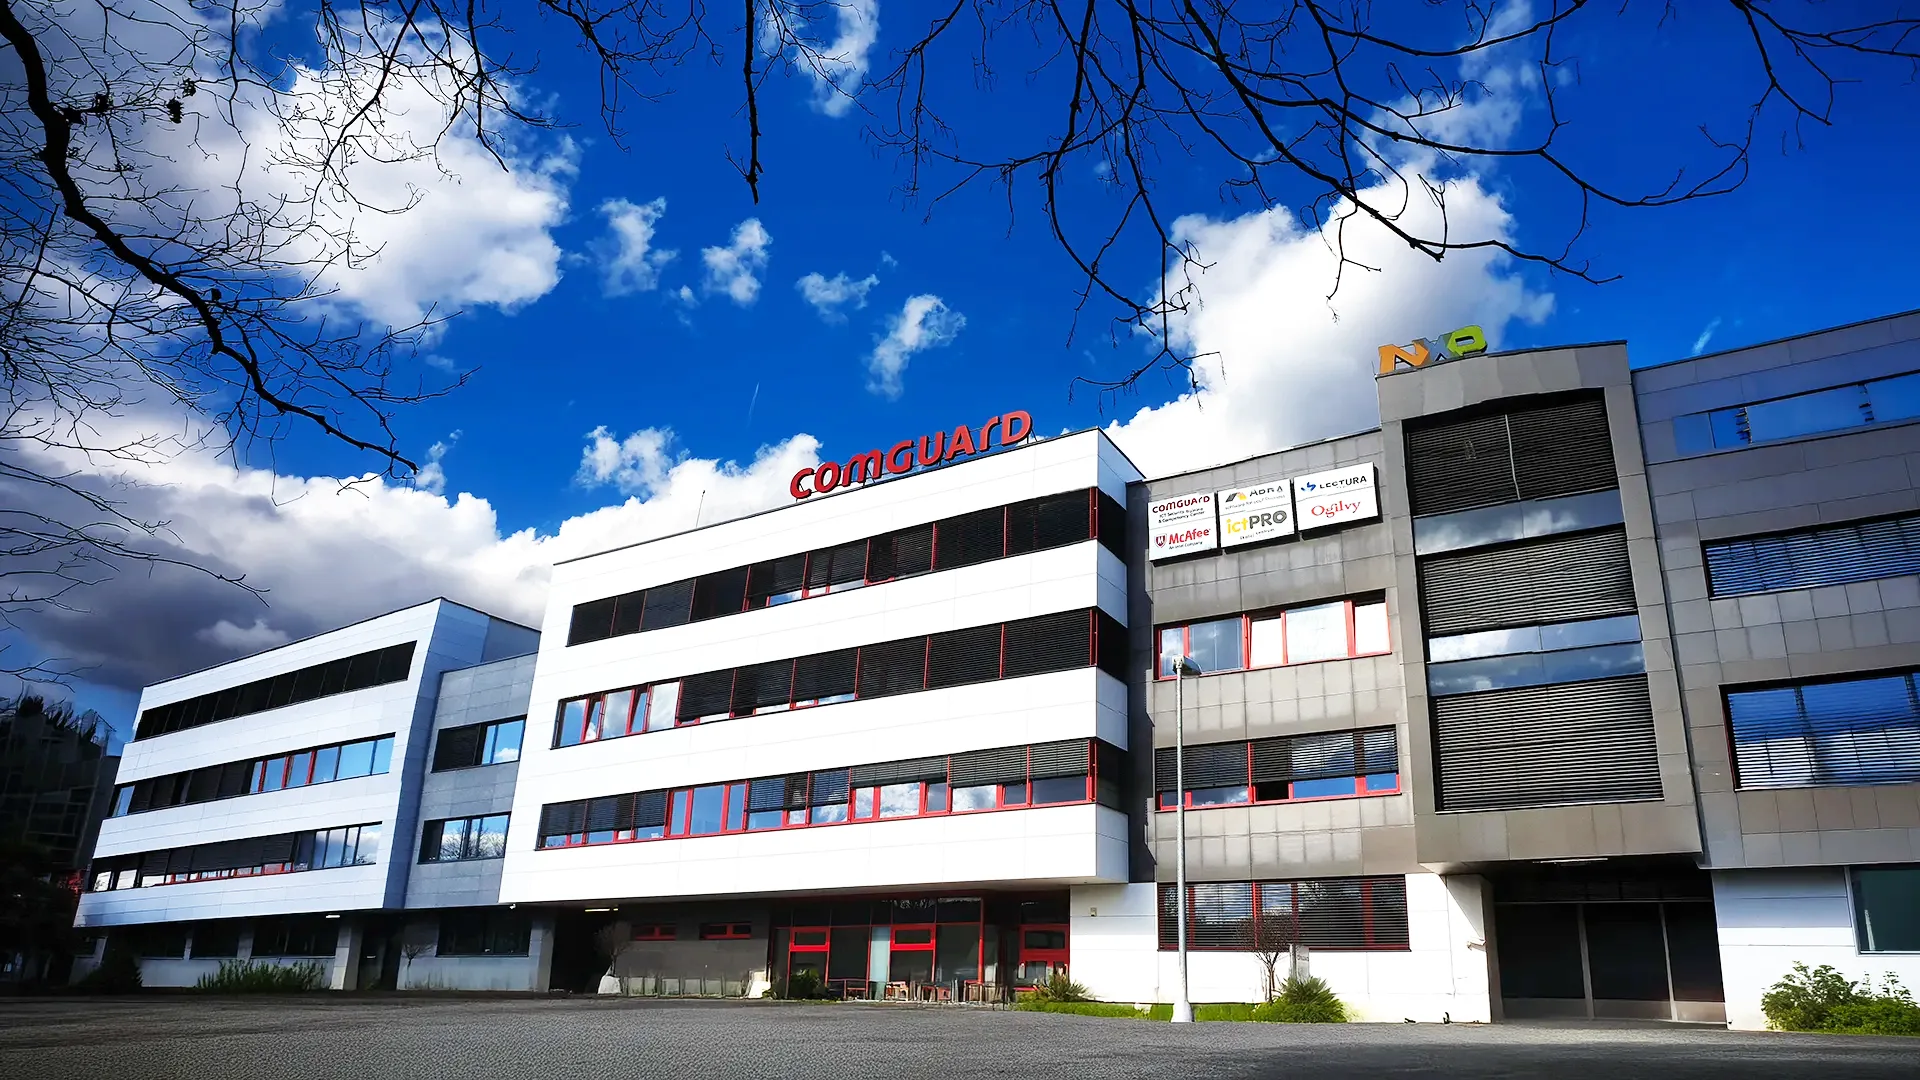 Where can you find our training center in Brno?The premises of the ICT Pro training center are located on the 1st floor of the COMGUARD building at Sochorova 38 in Brno. Positioned on the border of Žabovřesky and Komín, the location is easily accessible by both car and public transport.
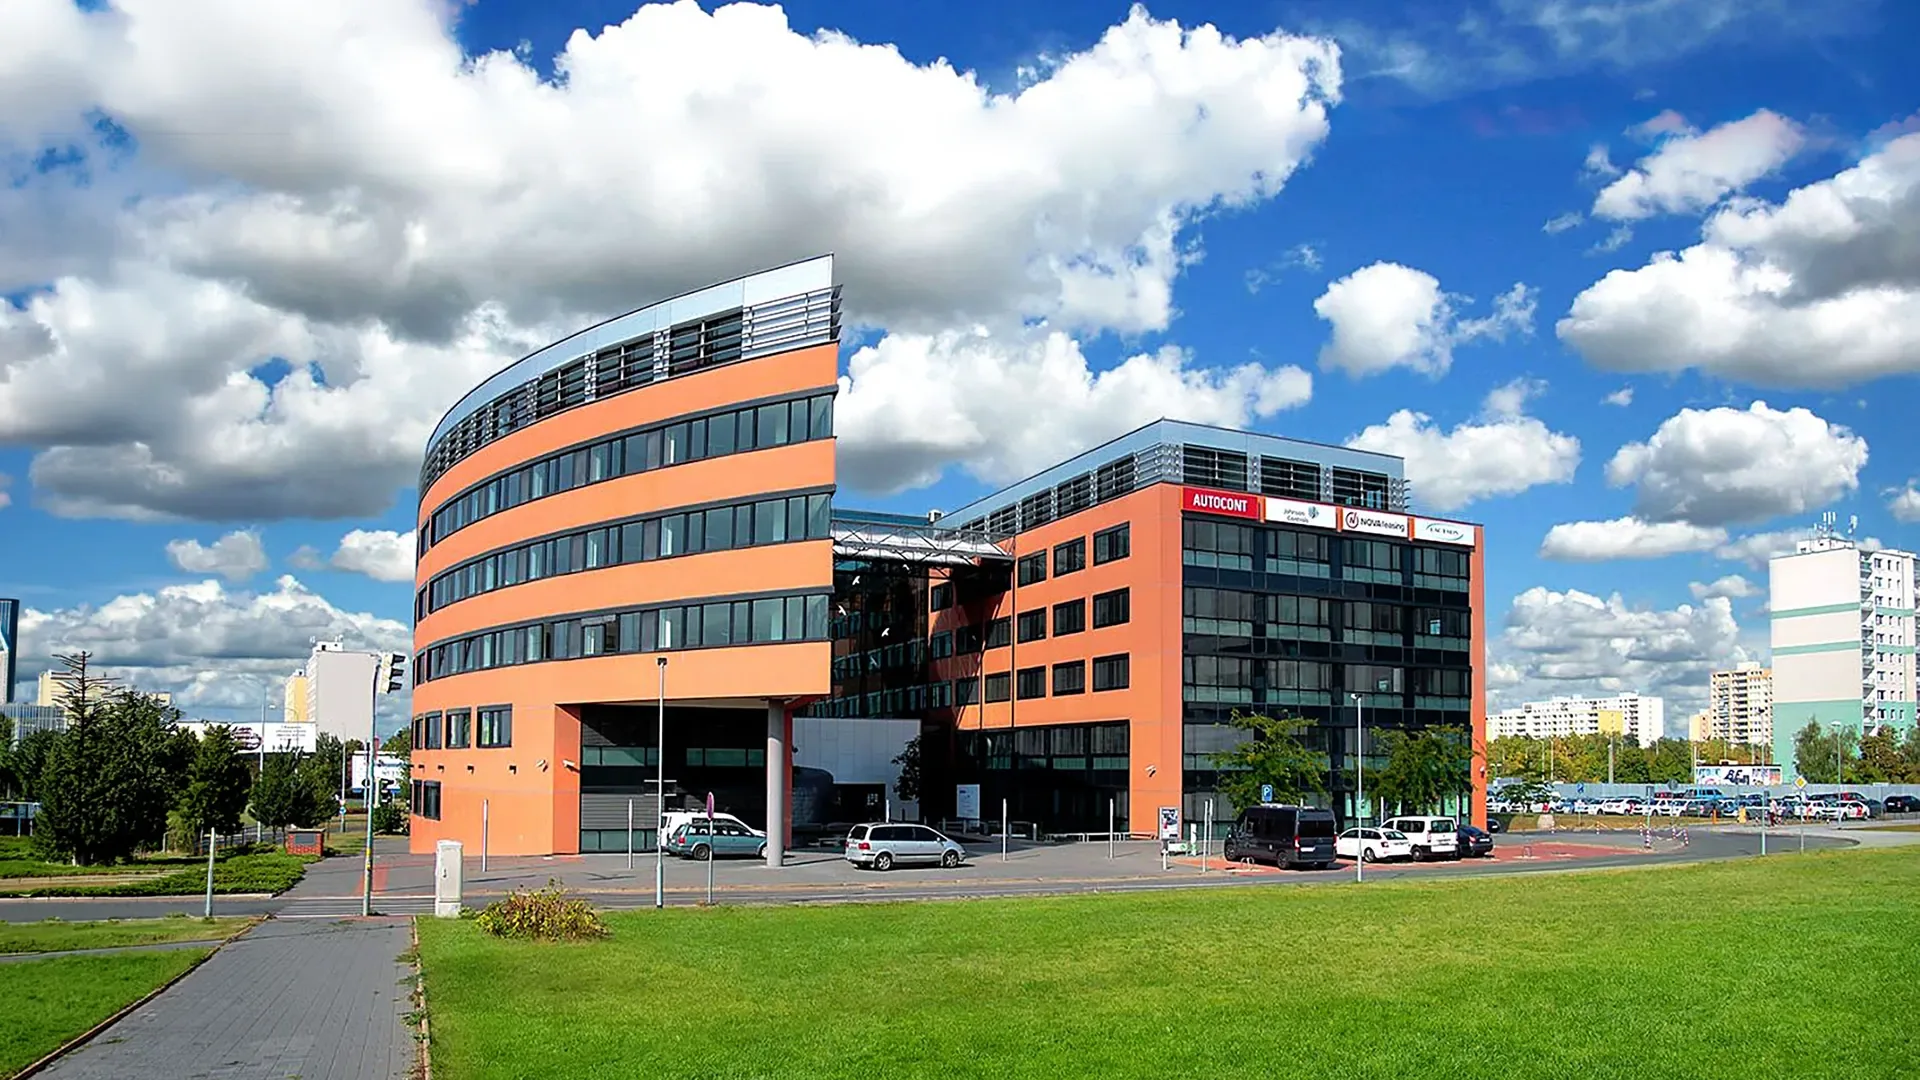 Where can you find our training center in Prague?The premises of the ICT Pro training center are located on the 1st floor of the Opatov Park building at Líbalova 1, Prague 11 – Chodov. The location provides a comfortable environment for your education with convenient access.
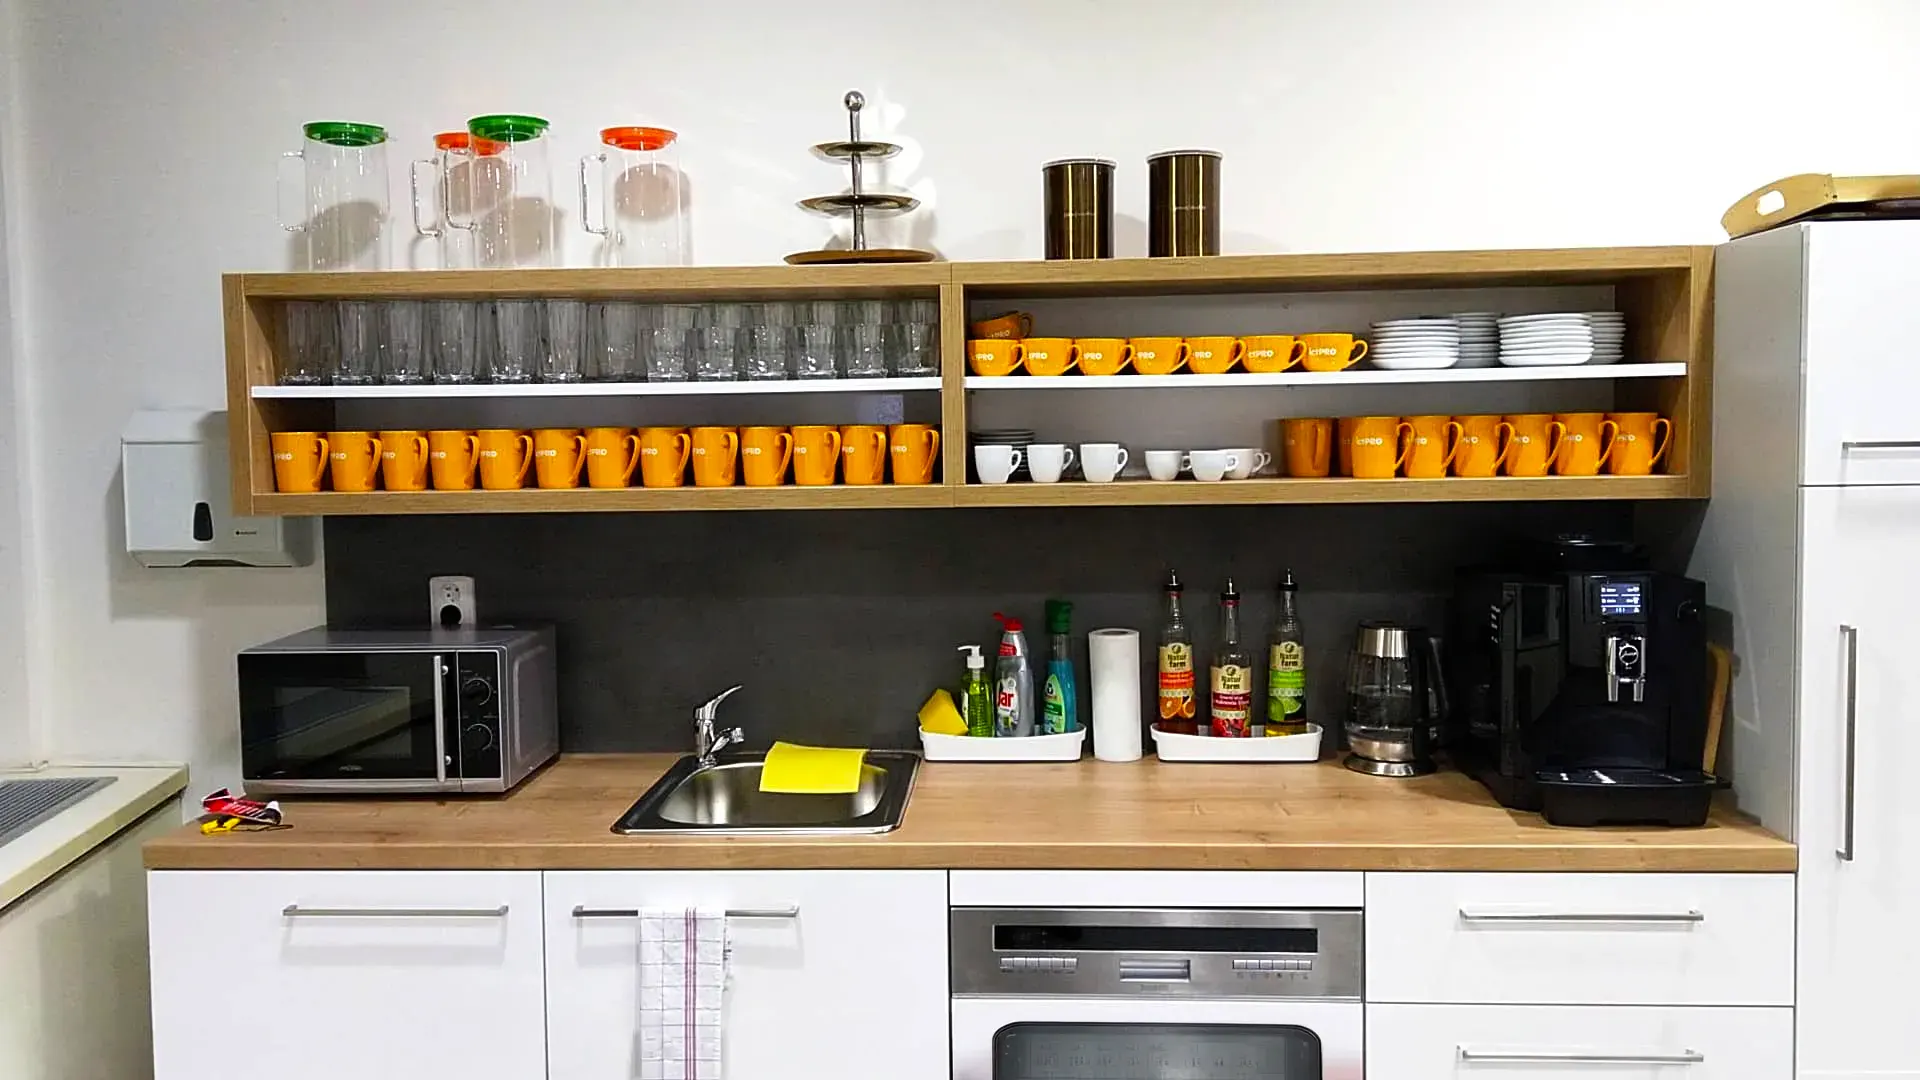 What facilities and refreshments are available to you during training breaks?Our training centers feature a fully equipped kitchenette for a comfortable break during your courses. The facilities include a coffee machine, microwave, kettle, and a wide selection of drinks and snacks.
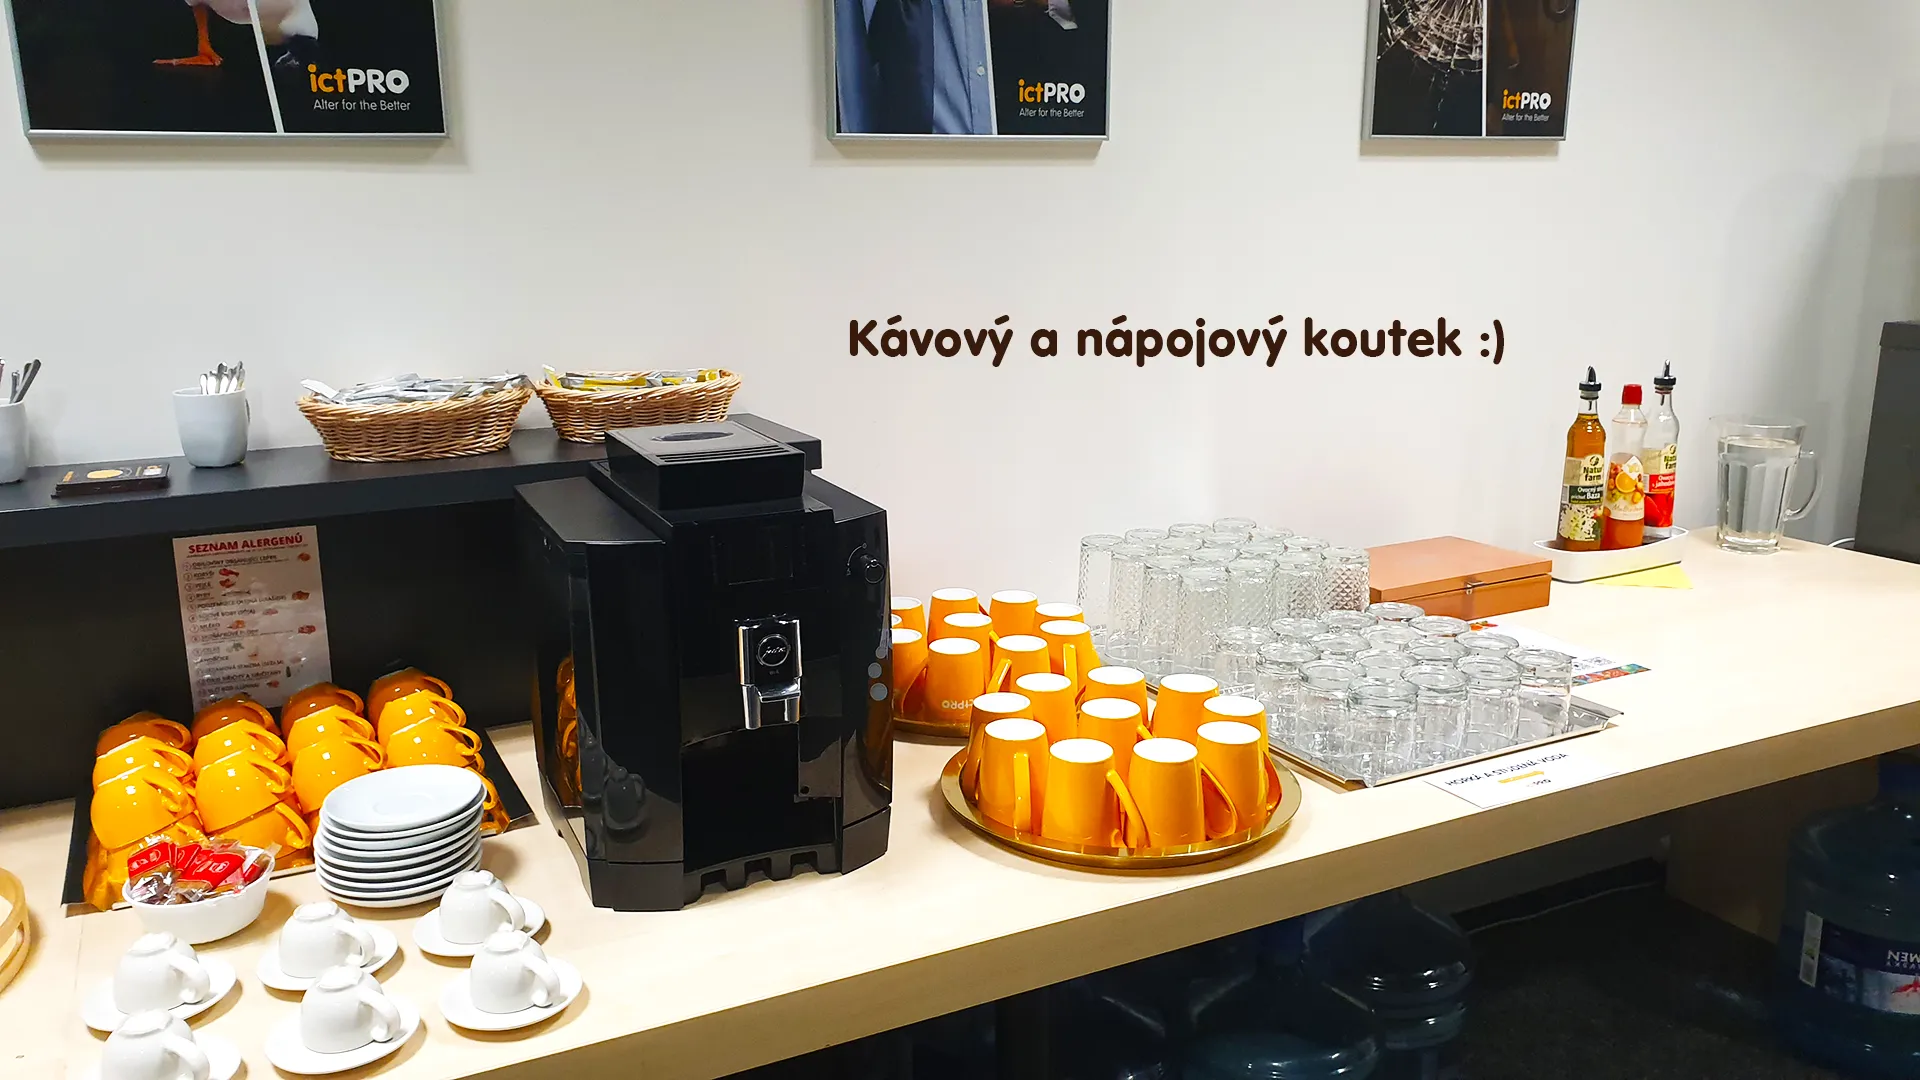 What beverage refreshments are available during your course?A beverage station with a coffee machine, teas, syrups, and water is at your disposal throughout the entire training session. You can enjoy a coffee or another drink of your choice anytime during breaks.
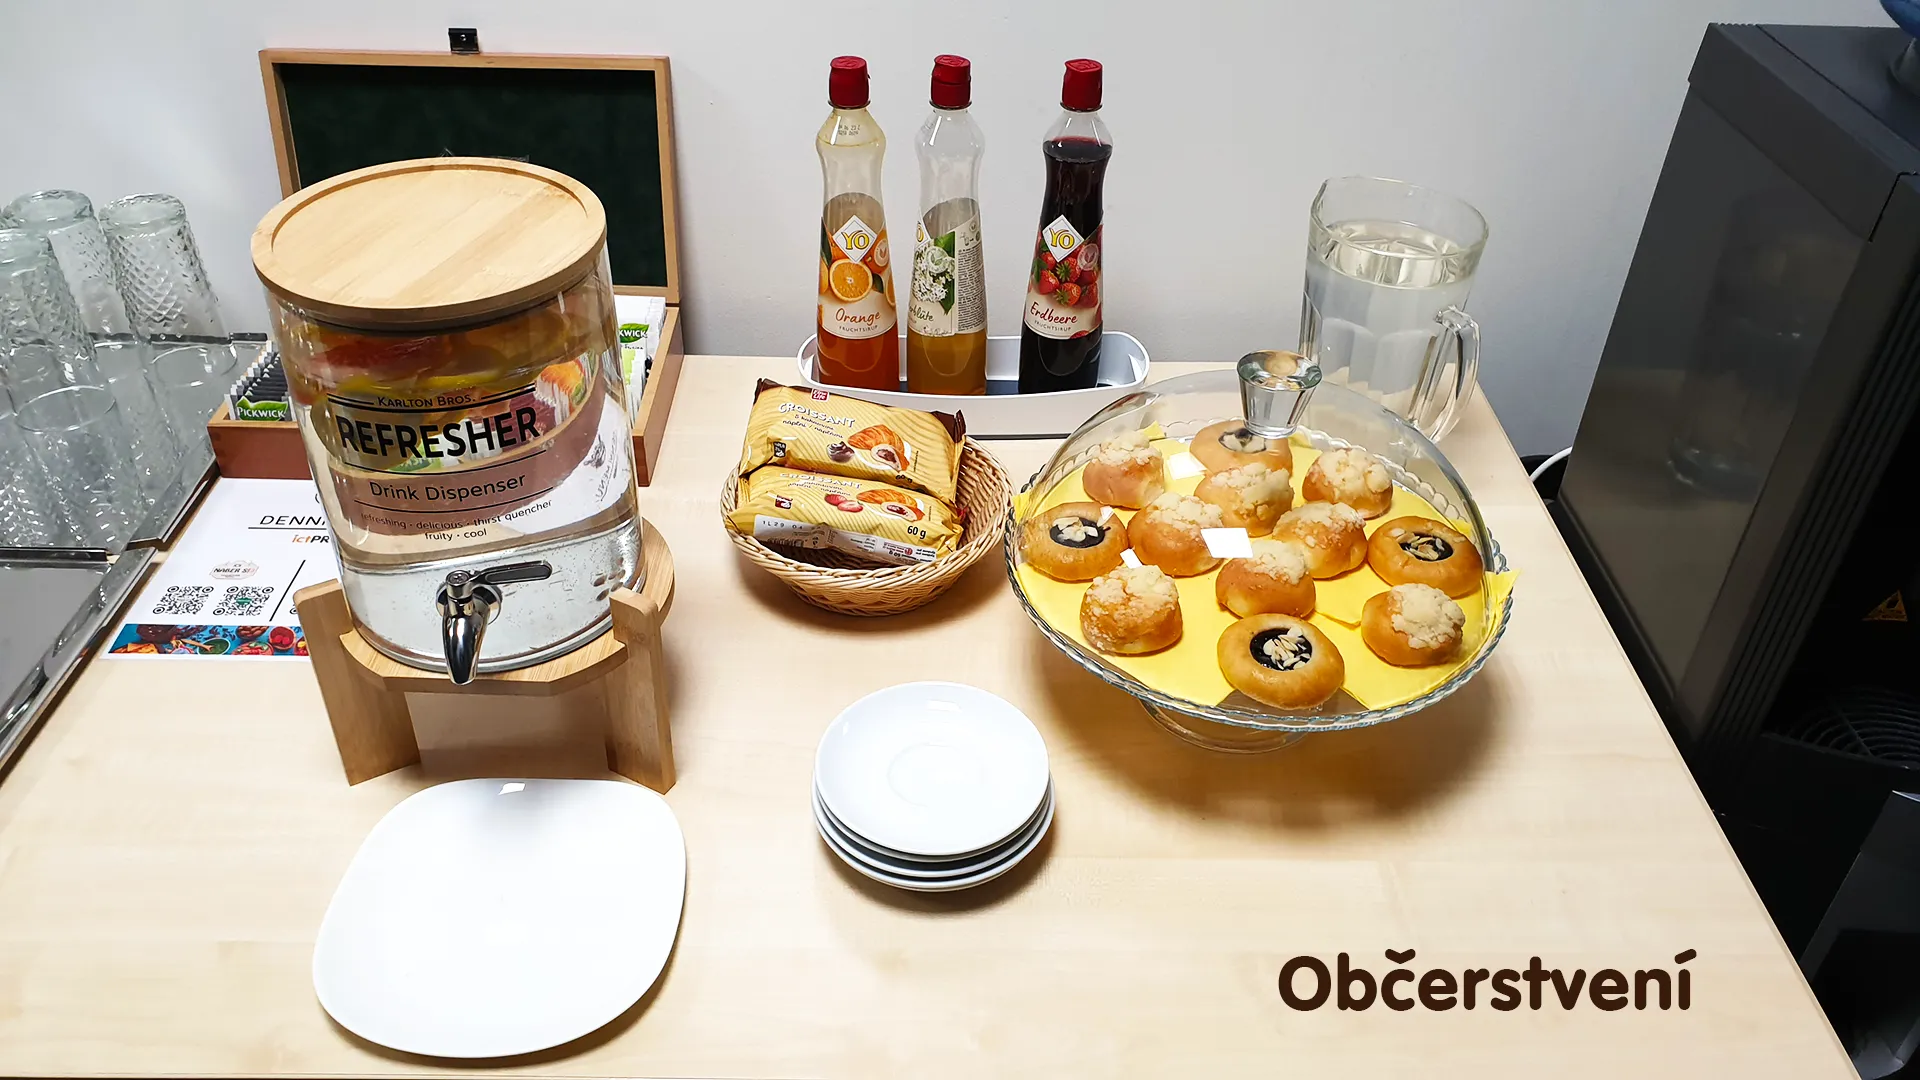 What light refreshments are provided for you during the courses?During course breaks, participants can enjoy light sweet snacks, pastries, and fruit syrups to mix their own drinks. Fresh water dispenser and plates are also available for your convenience.
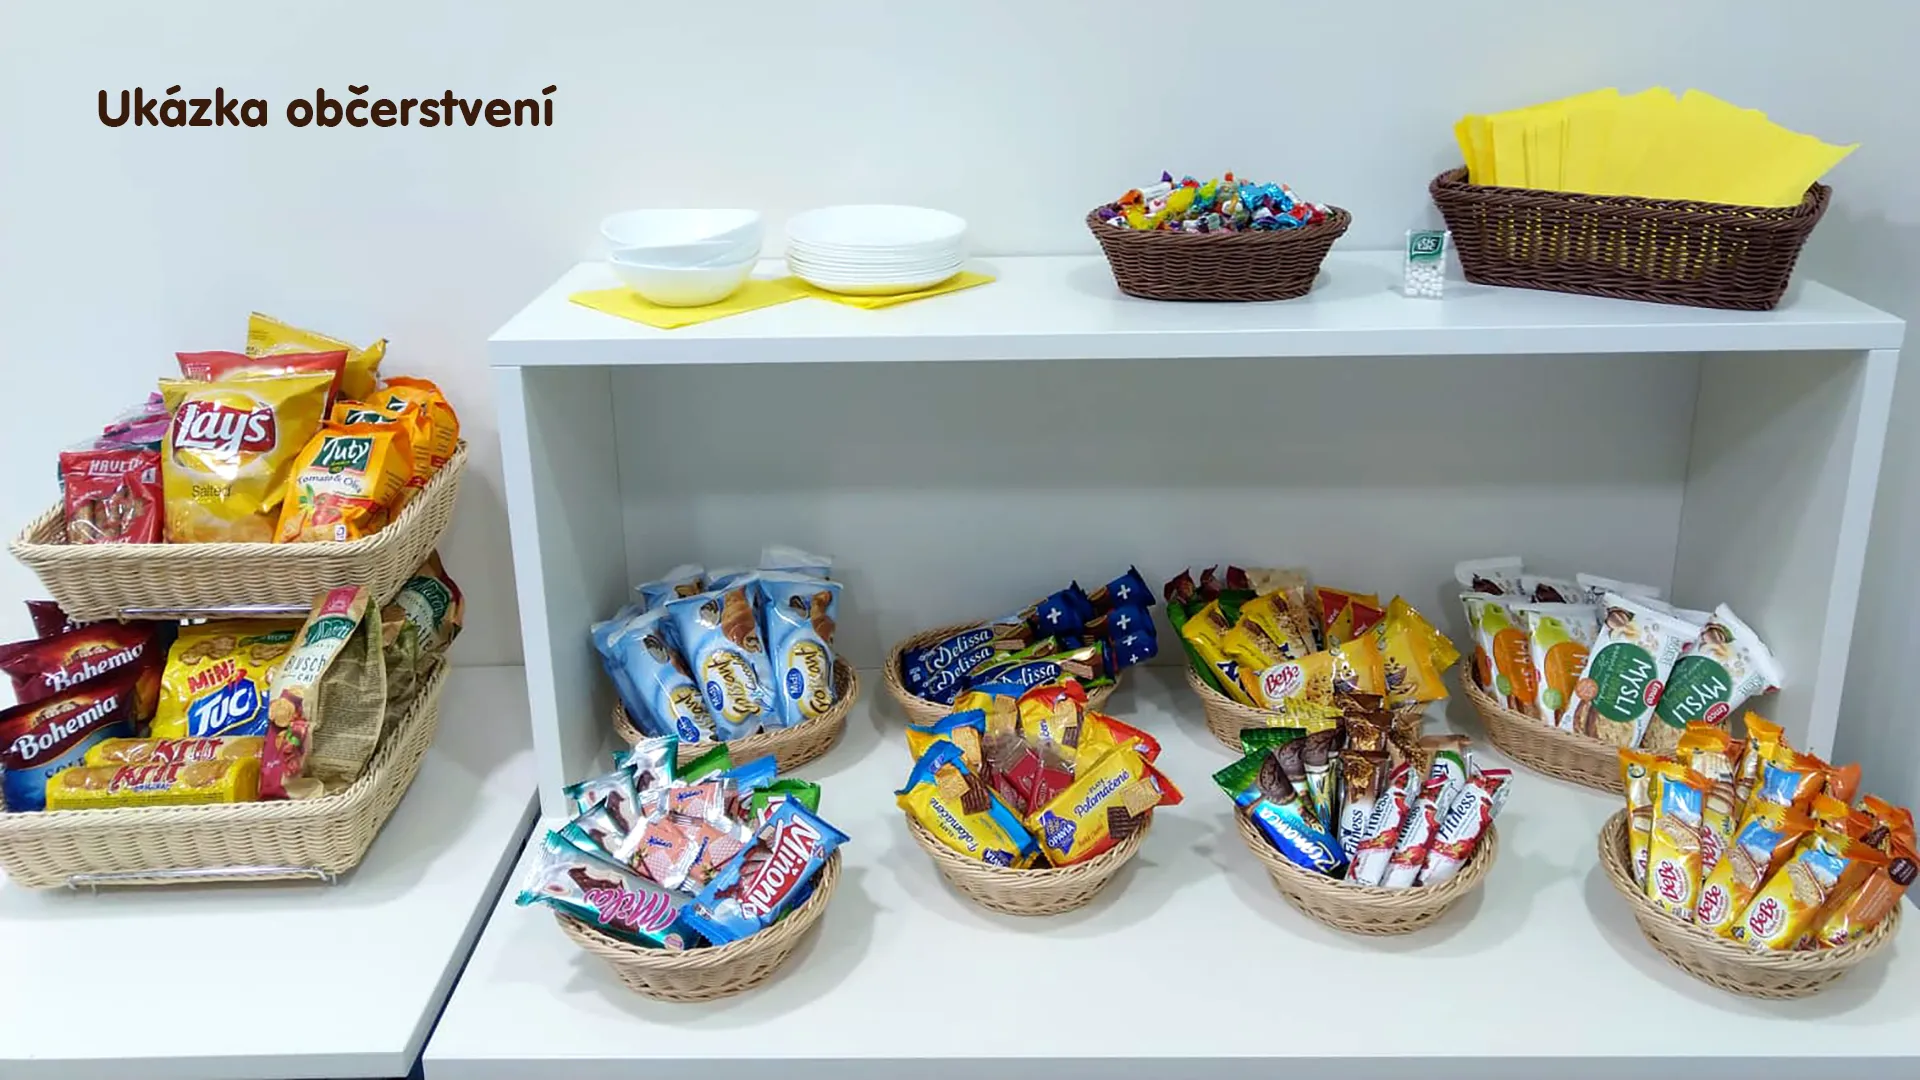 Should I bring my own snacks to ICT Pro training?There is no need to. A wide selection of savory snacks, sweet biscuits, and snack bars is available for you during breaks. Boost your energy for all-day focus right inside the training center premises.
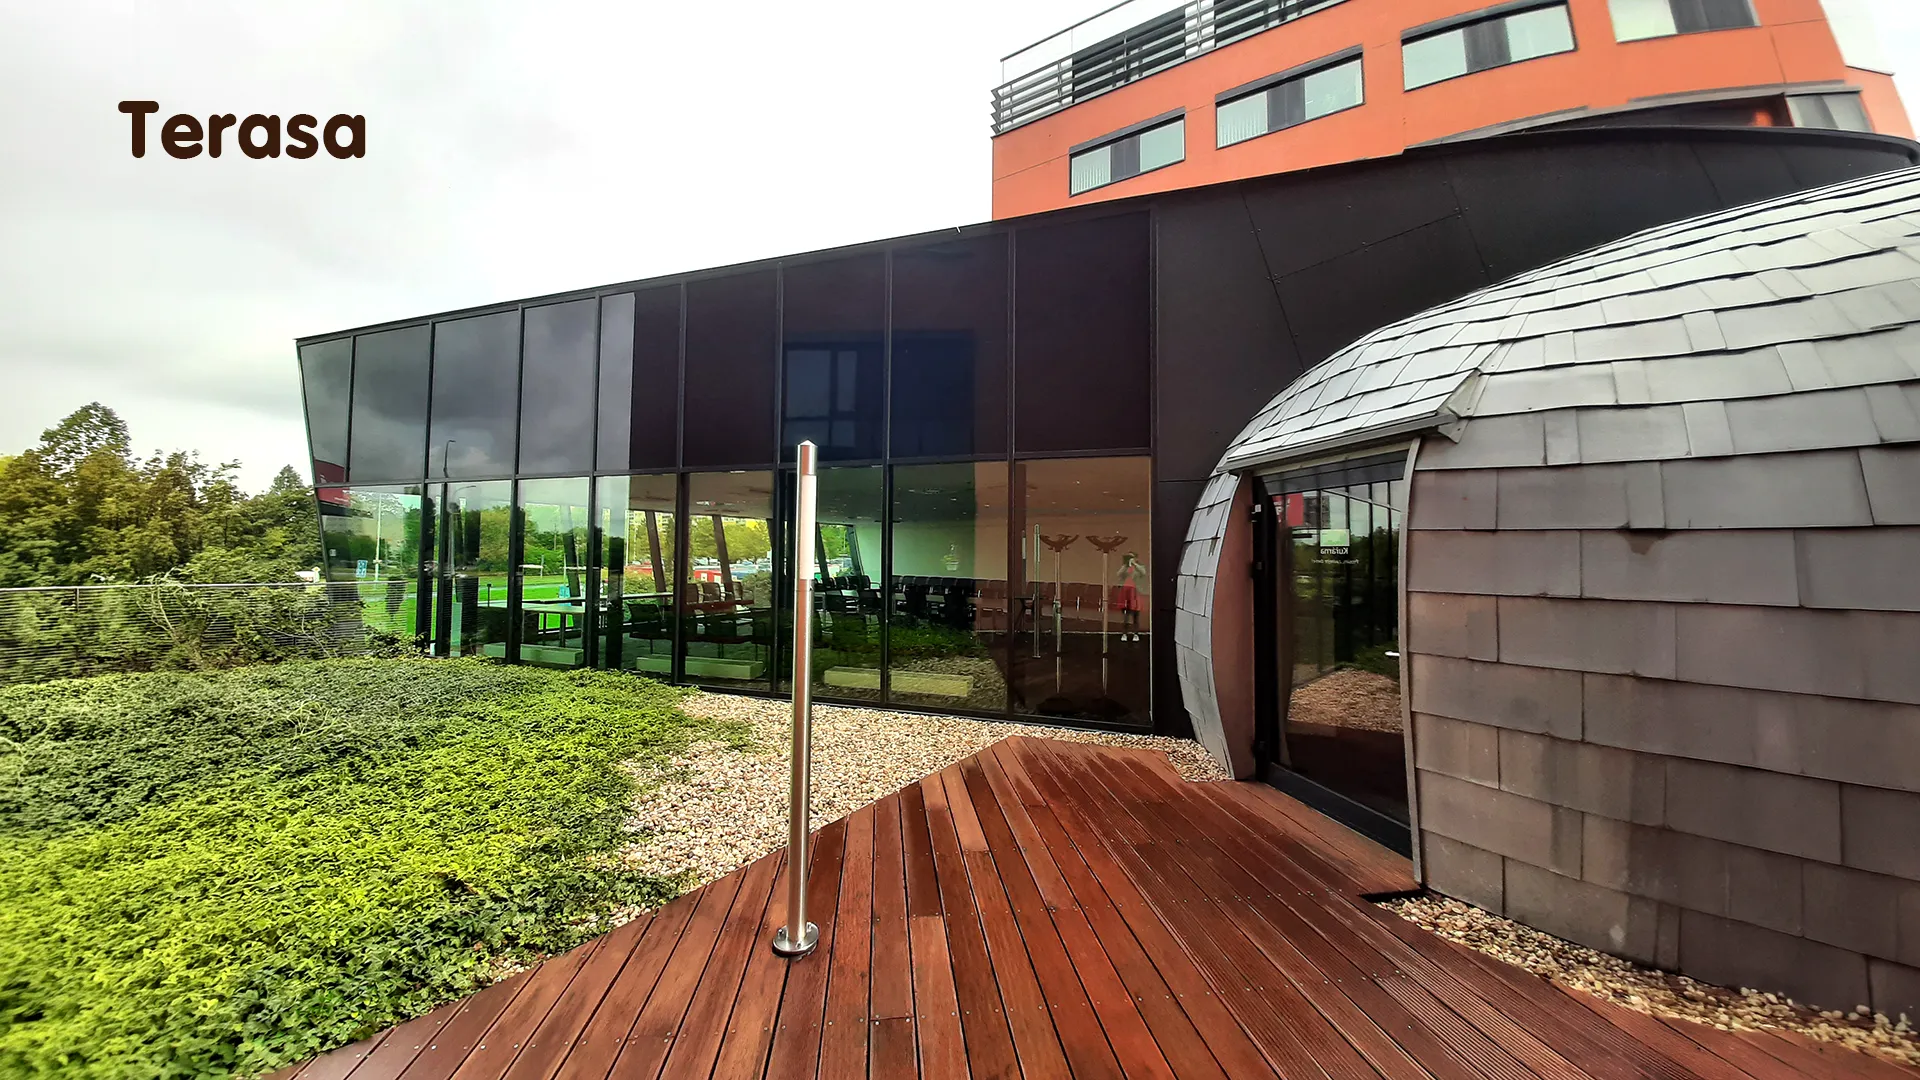 Can you spend training breaks in the fresh air?Yes, an outdoor terrace is available at our training center. During breaks between learning sessions, you can relax in the fresh air in a pleasant green environment.
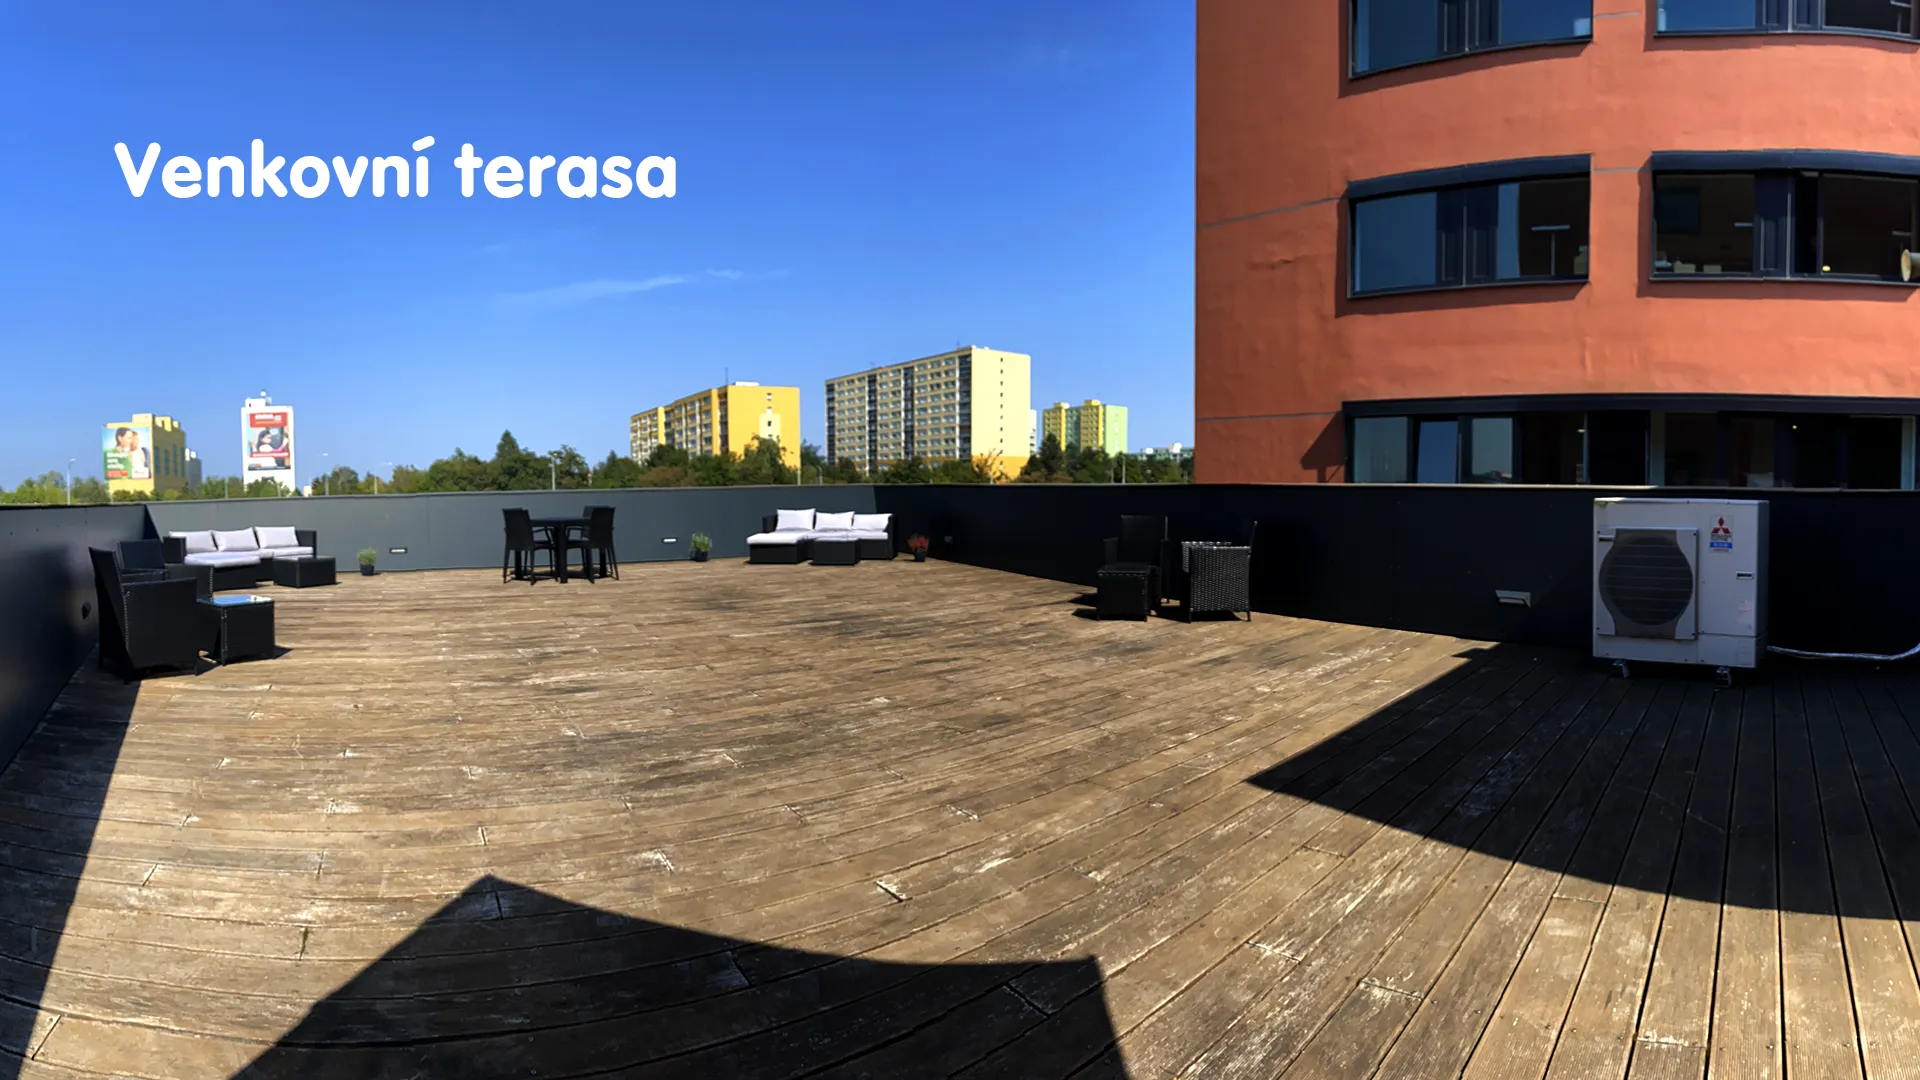 Where can you relax during course breaks?Our training center features a spacious outdoor terrace with seating options. During breaks between learning sessions, you can step outside to relax and recharge in the fresh air.