SQL for Analytical Reporting – the Direct Route to Your Data (SQLDA)
Databases, Data Analytics
SQL is a universal key to business information, and our goal is to teach you to use it as an essential working tool. If you know how to work with data in Excel, you already have the foundations for SQL. We will show you how to transfer these principles directly to the data source. You will gain the ability to retrieve clean, relevant data for any reporting tool, including Excel, Power BI, and Tableau.
The course is entirely practical. We will not get lost in theory—we work with one consistent dataset and demonstrate every concept alongside its spreadsheet-editor equivalent. We will bring in artificial intelligence as your personal data assistant, while keeping you in the role of the expert who remains firmly in control of the results.
THIS TRAINING COURSE WILL HELP YOU:
- Understand the logic of an SQL query and the order in which it is evaluated.
- Formulate queries to retrieve exactly what you need from a database for your analysis.
- Recognize and address common data problems.
- Validate AI-generated outputs and recognize when it is hallucinating or providing incorrect information.
- Connect an SQL query to any analytical or reporting tool and work with current data instead of static exports.
WHO SHOULD ATTEND?
- Junior business analysts, controllers, and data beginners
- Marketing, finance, HR, or sales analysts who have already encountered the limitations of exports from corporate systems
- Managers who need insight into their data and are not programmers
- Anyone planning to attend training in Power BI, Python, or another analytical tool and looking to make the start easier
- All curious users looking for modern ways to work with data
COURSE LOCATION AND AVAILABLE DATES
This public course is delivered online only, so you can attend remotely without travelling to a classroom. The same course can also be delivered in person as private training at your premises.
For technically demanding courses, prepared remote labs are provided, so you do not need to install anything locally.
7–8 Oct 2026
LASTMINUTE
CZECH
Need this course in English?
Public courses are usually delivered in Czech, but this course is also available in English. We can arrange private training for your team online, at your premises or in our classrooms, and tailor the content to your needs.
For groups of around 4 or more participants, private training can already be comparable in price to booking individual places on a public course. Send us your requirements and we’ll recommend the best format and provide an exact quote.
Request training in English
Course content:
Hide details
-
Why SQL and How to Think About Data
-
Where you encounter SQL: Power Query, Python, CRM/ERP, and BI tools
-
Mental model: table, column, row, and data type
-
The difference between a database, schema, table, and view
-
How to communicate with IT/DBAs—what access, a view, and a schema mean
-
The Anatomy of a SELECT Query
-
Four questions before every query: where from → what to filter → what to display → how to sort
-
The FROM, WHERE, SELECT, ORDER BY, and LIMIT / TOP clauses
-
The logical versus written order of query evaluation
-
Filtering operators: =, <, BETWEEN, IN, LIKE
-
Working habit: test the query on a small sample before running it in full
-
Reading error messages without panicking
-
Aggregation as a Pivot Table
-
Aggregate functions: SUM, COUNT, AVG, MIN, MAX
-
The GROUP BY clause as a direct analogy to pivot table row fields
-
WHERE vs. HAVING—filtering before aggregation versus after aggregation
-
COUNT(*) vs. COUNT(column)—why they are not the same
-
Column aliases and result readability for further processing
-
Data Hygiene and Common Problems
-
The unknown value NULL: how to work with “empty cells” that behave differently from zero and how to handle them safely
-
Detecting duplicates using GROUP BY + HAVING COUNT(*) > 1
-
Cleaning functions: DISTINCT, TRIM, LOWER/UPPER, COALESCE
-
Typical pitfalls: inconsistencies in text values and different representations of the same status
-
Checking whether results make sense before using them further in a report
-
Joining Tables—Putting Relationships Together
-
Why data does not live in a single table—an introduction to normalization
-
INNER JOIN (intersection)—selecting records that have matching pairs in both tables
-
LEFT JOIN (the XLOOKUP/VLOOKUP analogy)—how to add corresponding information to the main data and handle unmatched records
-
UNION ALL (stacking vertically)—combining data from identical structures
-
The analyst’s decision tree—how to identify which type of join you need at a given moment so that no data is lost
-
SQL and AI—Effective Collaboration
-
When AI helps with SQL (boilerplate, translating requirements, fixing errors) and when it fails (unknown schema, business logic, performance)
-
How to give AI the right context: table schemas, sample data, and the business semantics of columns
-
Four prompt types: generate, fix, explain, rewrite
-
Typical hallucinations in SQL output and how to detect them (invented column, incorrect JOIN type, silent filtering of NULL)
-
Verification checklist—applying everything from the previous modules
-
Iterative workflow: requirements → AI proposal → sample test → verification → correction
-
Demonstration of Connecting SQL to Analytical and Reporting Tools
-
Prerequisites:
-
User knowledge of MS Excel (working with structured tables, sorting, filtering data, and basic functions); no prior knowledge of SQL or programming is required
-
Recommended previous course:
-
MS Excel – PivotTables Without Fear (MSE3)
-
Recommended follow-up course:
-
SQL – Basics of Querying and Data Manipulation in SQL Server (SQL1)
-
Schedule:
-
2 days (9:00-17:00)
-
Price per person:
-
356.00 € ( 430.76 € incl. 21% VAT)
Training and learning environment
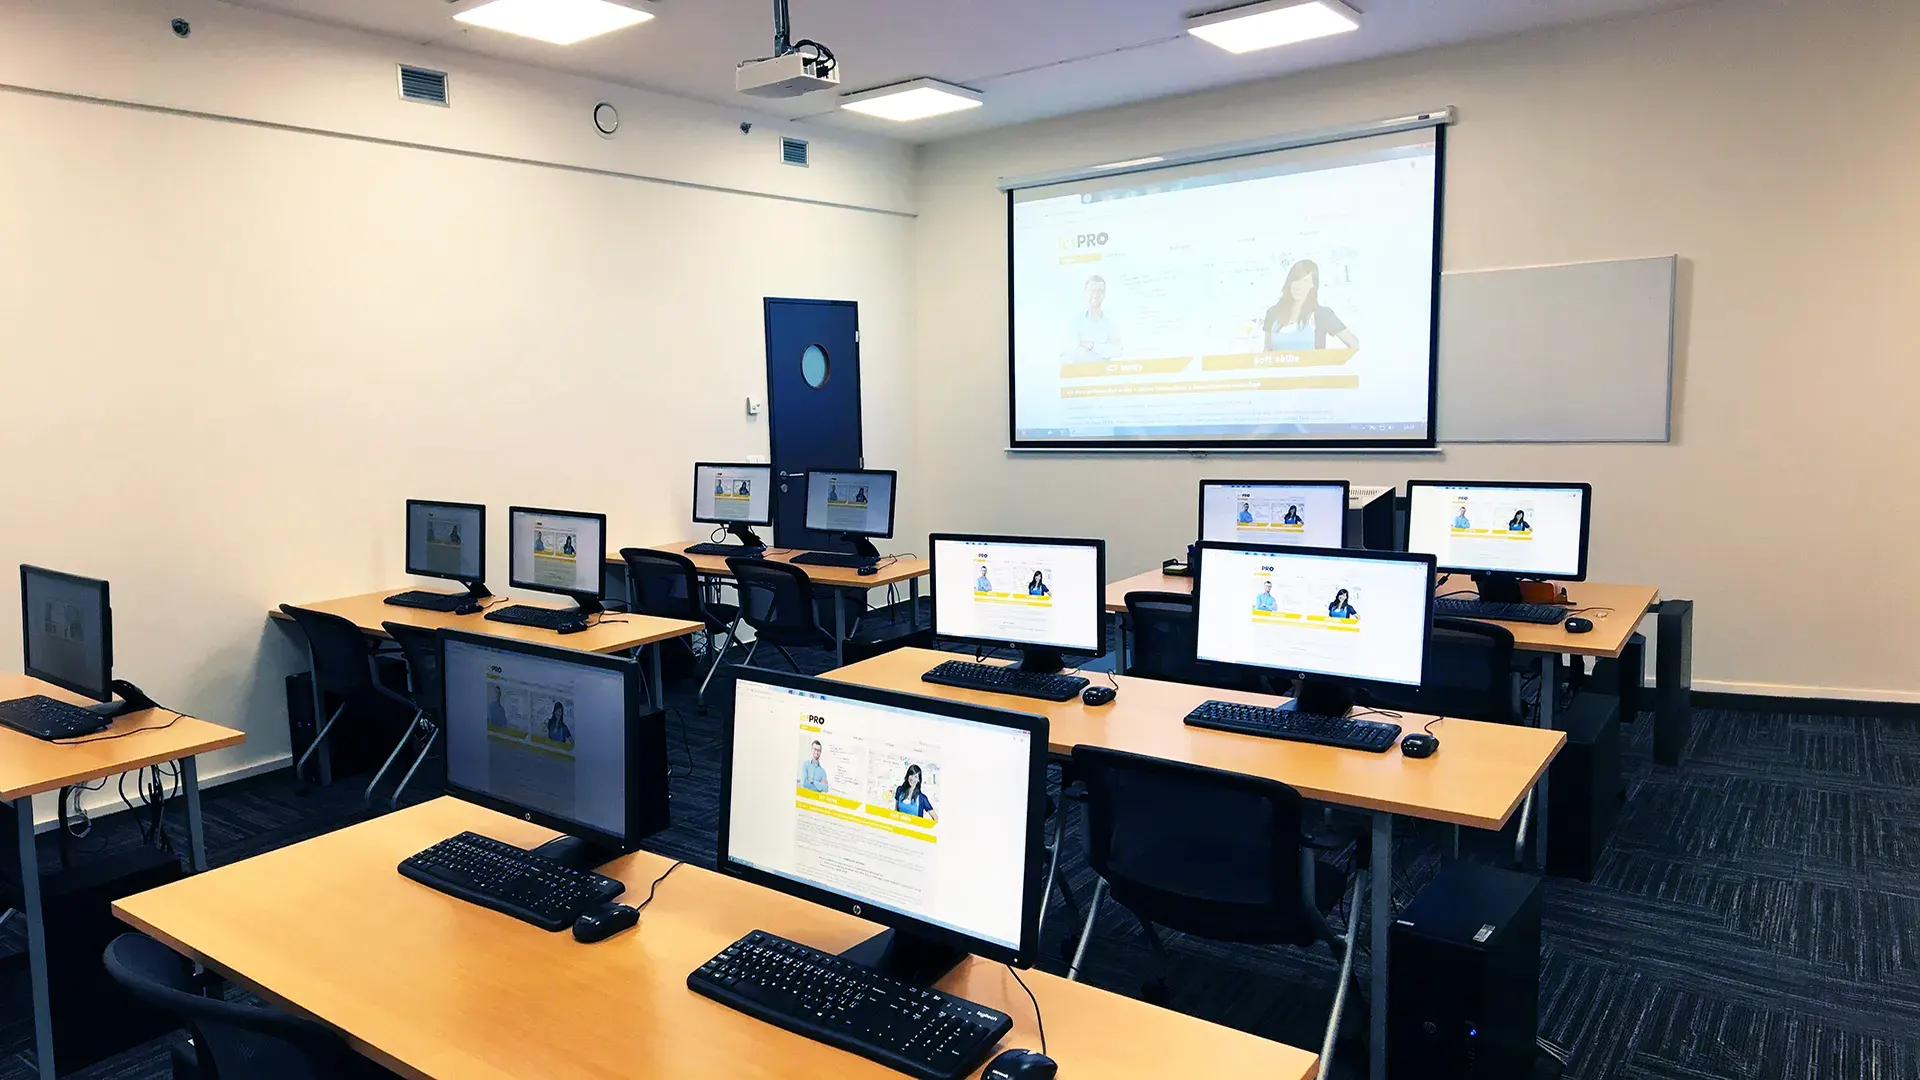 What does the environment for in-person IT courses look like?We hold training courses in our own classrooms equipped with modern computer equipment for each participant and a large projection screen. Each workstation is fitted with a powerful computer for seamless practical exercises, and the environment supports a calm, friendly atmosphere during training.
 Do I need to bring my own laptop to the classroom IT course?Our training rooms are fully equipped, so you do not need to bring your own laptop. A modern computer with all necessary hardware and software is ready for you at your workstation.
 Will you receive an official certificate after completing an IT course?Yes, upon successful completion of the training course, you will receive an official ICT Pro certificate confirming your participation and acquired technical skills. You can use it to verify your qualifications or add it to your professional profile.
 Where can you find our training center in Brno?The premises of the ICT Pro training center are located on the 1st floor of the COMGUARD building at Sochorova 38 in Brno. Positioned on the border of Žabovřesky and Komín, the location is easily accessible by both car and public transport.
 Where can you find our training center in Prague?The premises of the ICT Pro training center are located on the 1st floor of the Opatov Park building at Líbalova 1, Prague 11 – Chodov. The location provides a comfortable environment for your education with convenient access.
 What facilities and refreshments are available to you during training breaks?Our training centers feature a fully equipped kitchenette for a comfortable break during your courses. The facilities include a coffee machine, microwave, kettle, and a wide selection of drinks and snacks.
 What beverage refreshments are available during your course?A beverage station with a coffee machine, teas, syrups, and water is at your disposal throughout the entire training session. You can enjoy a coffee or another drink of your choice anytime during breaks.
 What light refreshments are provided for you during the courses?During course breaks, participants can enjoy light sweet snacks, pastries, and fruit syrups to mix their own drinks. Fresh water dispenser and plates are also available for your convenience.
 Should I bring my own snacks to ICT Pro training?There is no need to. A wide selection of savory snacks, sweet biscuits, and snack bars is available for you during breaks. Boost your energy for all-day focus right inside the training center premises.
 Can you spend training breaks in the fresh air?Yes, an outdoor terrace is available at our training center. During breaks between learning sessions, you can relax in the fresh air in a pleasant green environment.
 Where can you relax during course breaks?Our training center features a spacious outdoor terrace with seating options. During breaks between learning sessions, you can step outside to relax and recharge in the fresh air.