MS Excel – Data Visualization Tools (MSEG)
Microsoft Office, Excel
Learn practical techniques and modern principles for inserting and formatting charts in Excel, plus tools for presenting complex information clearly. The course covers chart choice, style and labels so you can show trends using charts, formatting and infographics.
Hands-on exercises and tips help you build basic and advanced visuals, combine chart types and create reusable templates. Learn to link charts to live data sources, control what displays and improve readability using templates, dynamic data and infographics.
THIS TRAINING COURSE WILL HELP YOU:
- Create and edit chart types from basic to advanced visualizations
- Choose the right chart type to match your data and message
- Work with data sources and speed up analysis with better visuals
- Improve presentation clarity to support decision-making
WHO SHOULD ATTEND?
- Employees who work with data and need clear visual reports
- Analysts and managers who interpret and present trends
- Marketing professionals and anyone preparing data presentations
COURSE LOCATION AND AVAILABLE DATES
Praha + online (optional)
Need this course in English?
Public courses are usually delivered in Czech, but this course is also available in English. We can arrange private training for your team online, at your premises or in our classrooms, and tailor the content to your needs.
For groups of around 4 or more participants, private training can already be comparable in price to booking individual places on a public course. Send us your requirements and we’ll recommend the best format and provide an exact quote.
Request training in English
Public course on a related topic
Course content:
Hide details
-
Principles of inserting charts and examples of chart use
-
Chart types and when to use each
-
Data sources for a chart
-
Dynamic sparklines and how to insert them into a cell
-
Formatting sparklines and practical uses
-
Chart formatting and editing options
-
Chart style and layout
-
Using themes and templates
-
Chart elements depending on the selected type
-
Options for titles, legend, labels, and more
-
Editing and formatting data series and data points
-
Advanced chart techniques
-
Dynamic data sources
-
Controlling data series display with form controls
-
Infographic elements for data presentation
-
Conditional formatting rules to show value strength and trends
-
Using icons, illustrations and shapes as visual indicators
-
Prerequisites:
-
Basic user-level knowledge of Excel.
-
Recommended previous course:
-
MS Excel – Efficient data processing for advanced users (MSE2)
-
Schedule:
-
1 day (9:00-17:00)
-
Price per person:
-
132.00 € ( 159.72 € incl. 21% VAT)
Training and learning environment
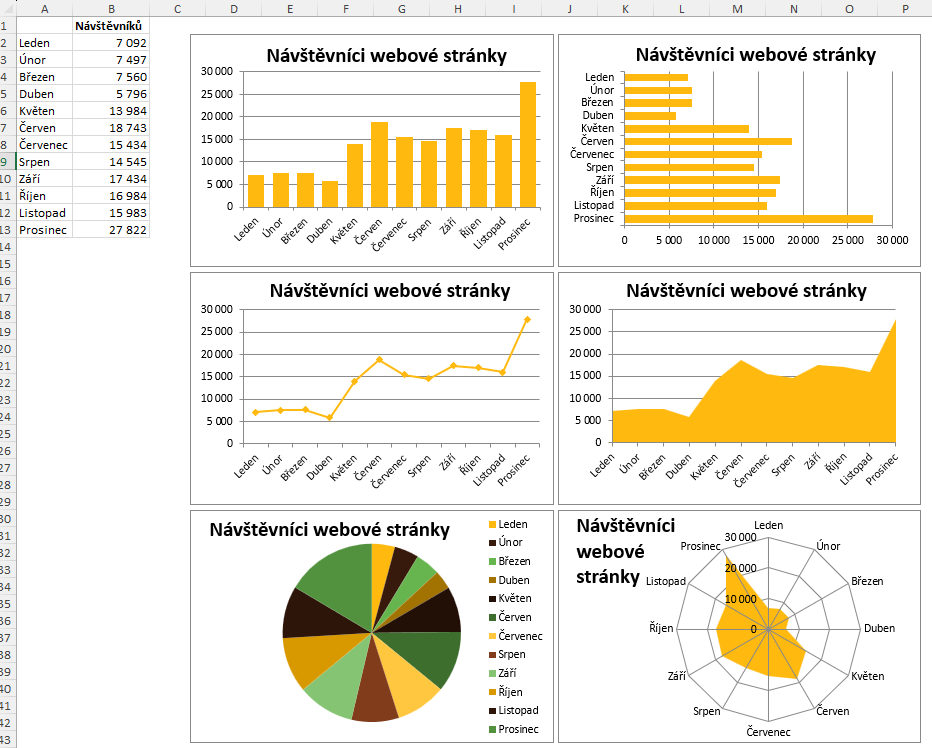 Why is choosing the right chart type crucial for data presentation?Different chart types present the same values in distinct ways, altering how the message is perceived. Selecting the correct chart ensures proper data interpretation, whereas an unsuitable format can mislead the audience.
 How to create and use a filled map chart in Excel?A filled map in Excel visualizes geographic data directly on a regional map. Through color coding, you can easily compare regional values and identify spatial patterns.
 What materials will you receive for the MS Excel courses?With our courses, you’ll receive clearly organized instructional materials covering everything from cell addressing to pivot tables and charts. These materials will serve as a useful guide for your daily work.
 Which new Excel functions and tools can simplify your daily workflow?A cheat sheet with an overview of new modern Microsoft 365 functions, along with practical keyboard shortcuts and data work examples. Participants in MS Excel courses use it as a quick reference for solving common and advanced tasks during training.
 What does the environment for in-person IT courses look like?We hold training courses in our own classrooms equipped with modern computer equipment for each participant and a large projection screen. Each workstation is fitted with a powerful computer for seamless practical exercises, and the environment supports a calm, friendly atmosphere during training.
 Do I need to bring my own laptop to the classroom IT course?Our training rooms are fully equipped, so you do not need to bring your own laptop. A modern computer with all necessary hardware and software is ready for you at your workstation.
 Will you receive an official certificate after completing an IT course?Yes, upon successful completion of the training course, you will receive an official ICT Pro certificate confirming your participation and acquired technical skills. You can use it to verify your qualifications or add it to your professional profile.
 Where can you find our training center in Brno?The premises of the ICT Pro training center are located on the 1st floor of the COMGUARD building at Sochorova 38 in Brno. Positioned on the border of Žabovřesky and Komín, the location is easily accessible by both car and public transport.
 Where can you find our training center in Prague?The premises of the ICT Pro training center are located on the 1st floor of the Opatov Park building at Líbalova 1, Prague 11 – Chodov. The location provides a comfortable environment for your education with convenient access.
 What facilities and refreshments are available to you during training breaks?Our training centers feature a fully equipped kitchenette for a comfortable break during your courses. The facilities include a coffee machine, microwave, kettle, and a wide selection of drinks and snacks.
 What beverage refreshments are available during your course?A beverage station with a coffee machine, teas, syrups, and water is at your disposal throughout the entire training session. You can enjoy a coffee or another drink of your choice anytime during breaks.
 What light refreshments are provided for you during the courses?During course breaks, participants can enjoy light sweet snacks, pastries, and fruit syrups to mix their own drinks. Fresh water dispenser and plates are also available for your convenience.
 Should I bring my own snacks to ICT Pro training?There is no need to. A wide selection of savory snacks, sweet biscuits, and snack bars is available for you during breaks. Boost your energy for all-day focus right inside the training center premises.
 Can you spend training breaks in the fresh air?Yes, an outdoor terrace is available at our training center. During breaks between learning sessions, you can relax in the fresh air in a pleasant green environment.
 Where can you relax during course breaks?Our training center features a spacious outdoor terrace with seating options. During breaks between learning sessions, you can step outside to relax and recharge in the fresh air.